Desktop Application Monitoring Settings
You can monitor desktop applications and review the collected data through various reports.
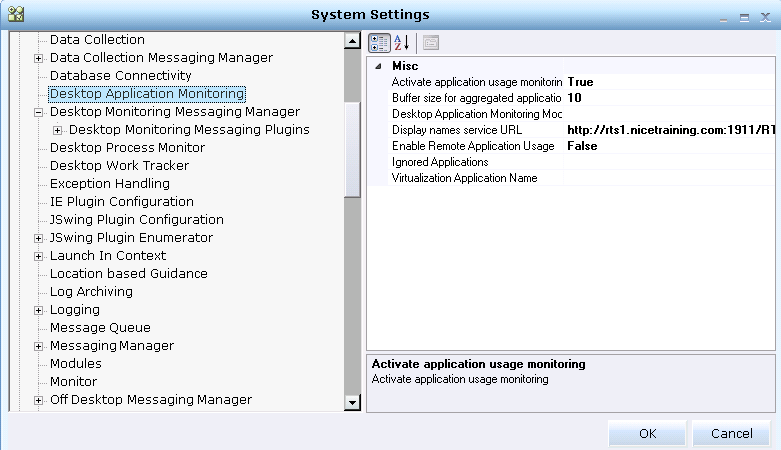
These settings are configured in the Designer Real-Time Client Settings, in the Desktop Application Monitoring branch.
The following settings are located in the Desktop Application Monitor branch:
| Setting | Details |
|---|---|
|
Activate application usage monitoring |
Determines whether to monitor for application usage. When set to True, application monitoring is enabled, and information about the active application and page is logged to the Real-Time server. This setting does not affect process monitoring in any way. |
|
Buffer size for aggregated application usage events stored in memory |
Specifies the maximum number of events in the buffer in memory that is used to store application usage events. When this limit is reached, events are flushed to persistent storage. Be sure to set this value so that the system is not overloaded. |
|
Desktop Application Monitoring Mode |
Specifies whether the client sends the monitoring information to another client (Citrix/desktop) or directly to the server. Valid values are Master or Slave. |
|
Display names service URL |
Specifies the URL used to receive the display names mapping from the Real-Time server. |
|
Enable Remote Application Usage |
Sets the use of the Citrix feature, as described in Desktop-to-Citrix Support for Application Usage Events Monitoring Configuration. |
|
Ignored Applications |
Specifies the applications (process names) not to be monitored. Multiple values can be entered, separated by semicolons (;). When a user moves from a monitored application to an ignored one, the current application event is closed and a new one is opened when a non-ignored application comes into focus. |
|
Virtualization Application Name |
Specifies the Citrix session process name that is to be ignored. This value is provided by the customer's IT department. See Desktop-to-Citrix Support for Application Usage Events Monitoring Configuration for details. |
Active application/page threshold: Specifies the amount of time, in seconds, to spend in an application before sending information to the Aggregator server. For example, if this value is five seconds, then if the user spends less than five seconds within the application, then this amount of time is logged in the Real-Time database, but is not sent to the Aggregator server.
Aggregator address: Specifies the TCP/IP address of the WFM Aggregator server. The Aggregator server is a component of the WFM system that receives from the Real-Time Solutions realtime application monitoring data, processes it and forwards it to the WFM server.
Aggregator monitor unknown applications: (Relevant only to the Application Monitoring events that are sent in real time to the aggregator.) Defines whether to monitor applications that do not appear in the display names table. This enables the user to filter only the relevant applications (with sensible names) in the monitoring process.
As this setting is only relevant to the Application Monitoring events that are sent in real time to the aggregator, all Application Monitoring information is still sent to the Real-Time-Server.
Aggregator port: Specifies the port used by the WFM Aggregator server.
Display Names Local File Path: Display names can use either the database or a local file on the client as the source for display name mappings. This parameter specifies the file path for the local file on the client. For more details, see Defining the Display Name for an Application.
Send messages to Aggregator: Specifies whether the WFM aggregation function is enabled or disabled. When set to True, data is sent to the WFM Aggregator server.